The following table shows the number of Laptops sold by five different stores…
2026
The following table shows the number of Laptops sold by five different stores A–E during the five different months from January till May in the year 2025. Based on the data in the table, answer the questions that follow:
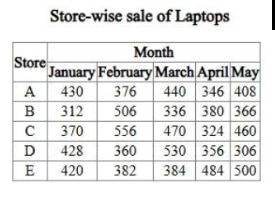
Q. Number of Laptops sold by store D in February and May together is approximately ______ % more than that by store B in January and March together.
Answer: D. 2.78 — Total laptops sold by Store D in Feb and May = 360 + 306 = 666. Total laptops sold by Store B in Jan and Mar = 312 + 336 = 648. Required percentage = [(666 -…
- A.
3.24
- B.
1.98
- C.
2.18
- D.
2.78
Attempted by 7 students.
Show answer & explanation
Correct answer: D
Total laptops sold by Store D in Feb and May = 360 + 306 = 666.
Total laptops sold by Store B in Jan and Mar = 312 + 336 = 648.
Required percentage = [(666 - 648) / 648] * 100 = (18/648) * 100 ≈ 2.78%.