Which of the following graphs does not represent regular (periodic) behaviour…
2009
Which of the following graphs does not represent regular (periodic) behaviour of the variable f(t)?
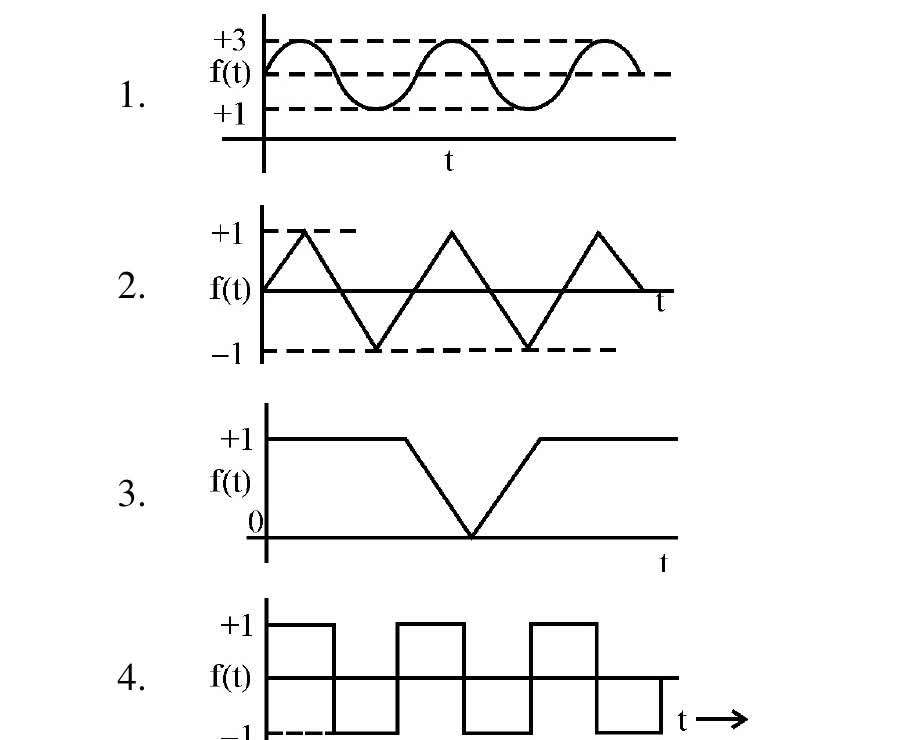
Answer: C. 3 — A variable f(t) shows regular (periodic) behaviour when there is a fixed positive interval T, called the period, such that f(t + T) = f(t) for every value of…
- A.
1
- B.
2
- C.
3
- D.
4
Show answer & explanation
Correct answer: C
A variable f(t) shows regular (periodic) behaviour when there is a fixed positive interval T, called the period, such that f(t + T) = f(t) for every value of t. In words, the whole shape of the curve must repeat unchanged, again and again, at equal gaps along the t-axis. Neither smoothness nor symmetry about the t-axis is required; only exact repetition after a fixed interval.
Apply that test to each graph in the figure:
Graph | What the trace does | Repeats after a fixed interval T? |
|---|---|---|
1 | Smooth wave rising to +3 and falling to +1 | Yes, the same rise-and-fall shape returns after a fixed t-interval |
2 | Triangular wave rising to +1 and falling to -1 | Yes, the same up-and-down shape returns after a fixed t-interval |
3 | Level at +1, one V-shaped dip down to 0, then level at +1 again | No, the dip happens once and never returns, so no fixed T satisfies f(t + T) = f(t) |
4 | Rectangular wave alternating between +1 and -1 | Yes, the same high-and-low shape returns after a fixed t-interval |
Cross-check the two usual traps. Sharp corners do not break periodicity: the triangular and the rectangular traces both have corners and both repeat exactly, so both are periodic. Lying entirely above the t-axis does not break it either: the smooth wave stays between +1 and +3 and never becomes negative, yet its shape still returns after a fixed interval. A single isolated feature, by contrast, belongs to no cycle at all, so one dip that never comes back rules out every possible T.
Hence the graph labelled 3 in the figure, the one that is level at +1 apart from a single V-shaped dip to 0, is the graph that does not represent regular (periodic) behaviour of f(t).