Study the data in the table and answer the questions that follow. Consider the…
2020
Study the data in the table and answer the questions that follow.
Consider the following table that shows the percentage (%) distribution of employees in five different departments A-E in a company during the years 2018 and 2019. There is a total number of 18000 and 20000 employees in the company during the years 2018 and 2019 respectively.
Department-wise Distribution of Employees
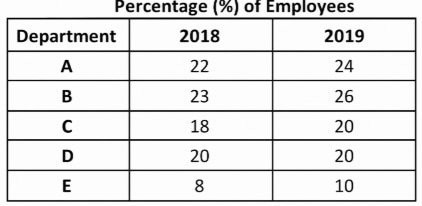
Ques: If the average monthly salary of employees in the Department - A was ₹ 24000 in 2018, then what was the approximate total salary expenses of the department - A in 2018?
Answer: D. ₹ 9.5 crores — Department-A had 22% of the employees in 2018. Number of employees in Department-A in 2018 = 22% of 18000 = (22/100) x 18000 = 3960. Total monthly salary…
- A.
1.2 crores
- B.
4.7 crores
- C.
₹ 1.4 crores
- D.
₹ 9.5 crores
Attempted by 33 students.
Show answer & explanation
Correct answer: D
Department-A had 22% of the employees in 2018.
Number of employees in Department-A in 2018 = 22% of 18000 = (22/100) x 18000 = 3960.
Total monthly salary expense = Number of employees x Average monthly salary = 3960 x 24000 = Rs 9,50,40,000.
Rs 9,50,40,000 is approximately Rs 9.5 crores.