The line graph given below shows the total number of TV sold and difference…
2025
The line graph given below shows the total number of TV sold and difference between cell phone and TV sold by five different shops (A, B, C, D and E).
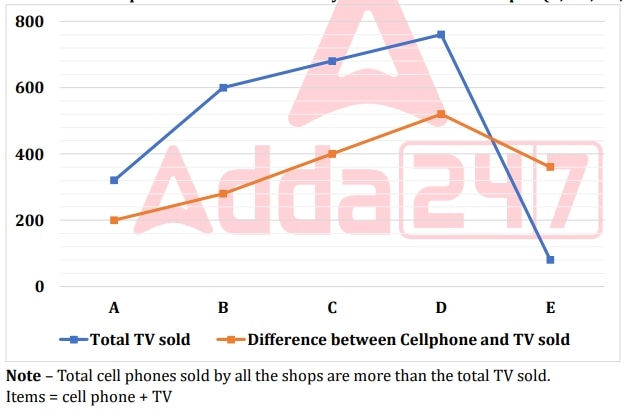
. Find the difference between sum of cell phone sold by C and E together and total items sold by A.
- A.
685
- B.
620
- C.
600
- D.
680
- E.
660
Attempted by 1 students.
Show answer & explanation
Correct answer: D
Concept
In a data-interpretation line graph, you may only read a quantity off the curve that is plotted; any other quantity must be reconstructed from a stated relation. Here one curve is "Total TV sold" and the other is "Difference between Cell phone and TV sold". The note fixes the sign of that difference: cell phones exceed TVs for every shop, so for each shop Cell phones = TV + Difference, and Total items = Cell phones + TV.
Reading the graph
Shop | TV | Difference | Cell phones = TV + Diff |
|---|---|---|---|
A | 320 | 200 | 520 |
C | 680 | 400 | 1080 |
E | 80 | 360 | 440 |
Application
Cell phones sold by C = TV at C + Difference at C = 680 + 400 = 1080.
Cell phones sold by E = TV at E + Difference at E = 80 + 360 = 440.
Sum of cell phones by C and E = 1080 + 440 = 1520.
Total items sold by A = Cell phones at A + TV at A = (320 + 200) + 320 = 520 + 320 = 840.
Required difference = 1520 - 840 = 680.
Cross-check
Re-add the two halves independently: cell phones for C and E are 1080 and 440 (sum 1520), and shop A contributes 520 cell phones plus 320 TVs (840 items). 1520 - 840 = 680, confirming the result. Note that "total items" for A must include both products, not TVs alone - dropping the cell-phone part of A is the most common slip.