The figure in Panel I is a 4×4 grid. The numbers on the top and left represent…
2026
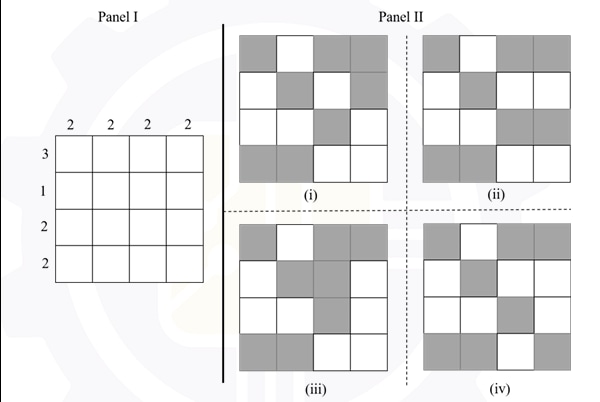
The figure in Panel I is a 4×4 grid.
The numbers on the top and left represent the number of cells to be shaded in that column and row respectively.
Which one of the options in Panel II represents the correctly shaded grid?
- A.
(i)
- B.
(ii)
- C.
(iii)
- D.
(iv)
Attempted by 38 students.
Show answer & explanation
Correct answer: B
From Panel I, the required row counts from top to bottom are 3, 1, 2, and 2. The required column counts from left to right are 2, 2, 2, and 2.
Check each option against both sets of counts.
Option (ii) has 3 shaded cells in the first row, 1 in the second row, 2 in the third row, and 2 in the fourth row. Its four columns also each contain exactly 2 shaded cells.
The other options fail at least one row or column count.
Therefore, the correctly shaded grid is option (ii).
A video solution is available for this question — log in and enroll to watch it.