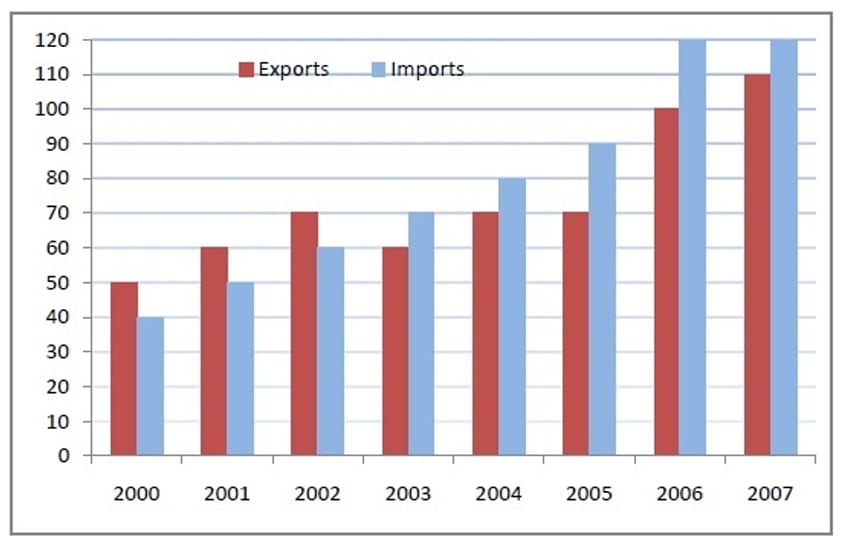
The exports and imports (in crores of Rs.) of a country from the year 2000 to…
2015
The exports and imports (in crores of Rs.) of a country from the year 2000 to 2007 are given in the following bar chart. In which year is the combined percentage increase in imports and exports the highest?
Attempted by 108 students.
Show answer & explanation
Correct answer: 2006
Approach: For each year after 2000, compute the percentage change in exports and the percentage change in imports compared to the previous year, then add those two percentages to get the combined percentage change for that year.
Values read from the chart:
Exports (2000 to 2007): 50, 60, 70, 60, 70, 70, 100, 110
Imports (2000 to 2007): 40, 50, 60, 70, 80, 90, 120, 120
2001 compared to 2000: Exports 50→60 = +10 (20.00%), Imports 40→50 = +10 (25.00%). Combined ≈ 45.00%.
2002 compared to 2001: Exports 60→70 = +10 (16.67%), Imports 50→60 = +10 (20.00%). Combined ≈ 36.67%.
2003 compared to 2002: Exports 70→60 = -10 (-14.29%), Imports 60→70 = +10 (16.67%). Combined ≈ 2.38%.
2004 compared to 2003: Exports 60→70 = +10 (16.67%), Imports 70→80 = +10 (14.29%). Combined ≈ 30.95%.
2005 compared to 2004: Exports 70→70 = 0 (0.00%), Imports 80→90 = +10 (12.50%). Combined = 12.50%.
2006 compared to 2005: Exports 70→100 = +30 (42.86%), Imports 90→120 = +30 (33.33%). Combined ≈ 76.19%.
2007 compared to 2006: Exports 100→110 = +10 (10.00%), Imports 120→120 = 0 (0.00%). Combined = 10.00%.
Conclusion: The combined percentage increase in imports and exports is highest in 2006 (approximately 76.19%).