The following pie charts give information about the distribution of proteins…
2024
The following pie charts give information about the distribution of proteins in various parts of the human body and the distribution of the various components of the human body. Study the pie charts and answer the question.
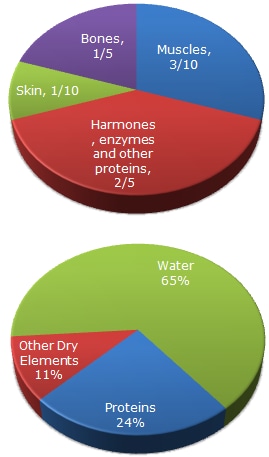
What is the ratio of the distribution of proteins in the muscles to that of the distribution of proteins in the bones?
- A.
2:1
- B.
2:3
- C.
3:2
- D.
Cannot be determined
Show answer & explanation
Correct answer: C
When a pie chart gives every category's share as a fraction (or percentage) of the SAME total, the ratio between any two categories can be found by directly comparing their fractions after expressing them over a common denominator -- the total itself cancels out, so no other information is needed.
From the pie chart, the protein distributed to the muscles is 3/10 of the total protein, and the protein distributed to the bones is 1/5 of the total protein.
Express both fractions over a common denominator of 10: muscles = 3/10 and bones = 1/5 = 2/10.
Compare the two numerators directly (since the denominators now match): muscles : bones = 3 : 2.
As a check, all four wedges of the chart (muscles 3/10, bones 2/10, skin 1/10, hormones/enzymes/other proteins 4/10) add up to 10/10 = 1, confirming the readings are consistent parts of one whole, so the 3:2 comparison is valid.