The bar graph given below shows the production of paper (in lakh tonnes) by…
2023
The bar graph given below shows the production of paper (in lakh tonnes) by three different companies X, Y and Z over the years.
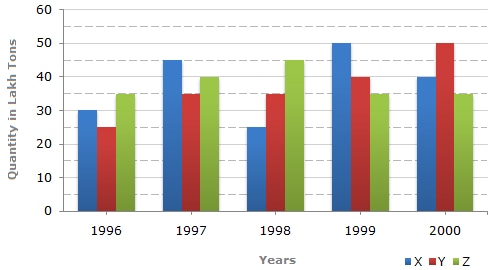
For which of the following years is the percentage rise/fall in production from the previous year the maximum for Company Y?
- A.
1997
- B.
1998
- C.
1999
- D.
2000
Attempted by 1 students.
Show answer & explanation
Correct answer: A
Concept: The percentage change (rise or fall) in a quantity from one year to the next is given by the formula: Percentage change = [(Value in current year − Value in previous year) / Value in previous year] × 100. A positive value is a rise and a negative value is a fall. To find the year of the maximum change, this ratio (not the raw absolute difference) must be compared across all years, since the same absolute change corresponds to different percentage changes depending on the base value.
Application: From the bar graph, Company Y's production (in lakh tonnes) was 25 in 1996, 35 in 1997, 35 in 1998, 40 in 1999, and 50 in 2000. The year-on-year percentage change is calculated as:
1997 over 1996: [(35 − 25) / 25] × 100 = 40% rise.
1998 over 1997: [(35 − 35) / 35] × 100 = 0% change.
1999 over 1998: [(40 − 35) / 35] × 100 ≈ 14.29% rise.
2000 over 1999: [(50 − 40) / 40] × 100 = 25% rise.
Cross-check: Comparing the four computed percentage changes — 40%, 0%, 14.29%, and 25% — the largest magnitude is 40%, confirming there is no other year with a bigger swing (rise or fall) for Company Y.
Hence, the year with the maximum percentage rise/fall in production for Company Y is 1997.