The bar graph below shows the production of paper (in lakh tonnes) by three…
2023
The bar graph below shows the production of paper (in lakh tonnes) by three companies — X, Y and Z — over the years 1996 to 2000.
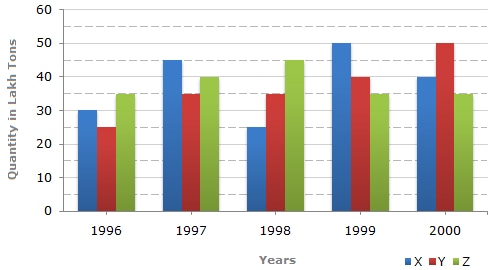
In which year was the percentage of production of Company Z to the production of Company Y the maximum?
- A.
1996
- B.
1997
- C.
1998
- D.
1999
Attempted by 2 students.
Show answer & explanation
Correct answer: A
Concept: To find the year in which one quantity is the maximum percentage of another, compute (numerator value ÷ base value) × 100 separately for every year and then compare the results — the year with the greatest resulting percentage is the answer. A larger raw value in a given year does not by itself mean a larger percentage relative to the base for that year.
Application: Reading Company Y (the base) and Company Z (the numerator) from the bar graph for each year and computing Z as a percentage of Y:
Year | Company Y (lakh tonnes) | Company Z (lakh tonnes) | Z as % of Y |
|---|---|---|---|
1996 | 25 | 35 | (35 ÷ 25) × 100 = 140% |
1997 | 35 | 40 | (40 ÷ 35) × 100 ≈ 114.29% |
1998 | 35 | 45 | (45 ÷ 35) × 100 ≈ 128.57% |
1999 | 40 | 35 | (35 ÷ 40) × 100 = 87.5% |
2000 | 50 | 35 | (35 ÷ 50) × 100 = 70% |
Cross-check: Z exceeds Y only in 1996, 1997 and 1998, so only these three years can give a percentage above 100%; in 1999 and 2000, Z is smaller than Y, so their percentages are necessarily below 100%. Among the three years above 100%, 140% (1996) is greater than both 128.57% (1998) and 114.29% (1997).
Result: The percentage of Company Z's production to Company Y's production is maximum in 1996.