Study the following line graph and answer the questions based on it.Number of…
2023
Study the following line graph and answer the questions based on it.Number of Vehicles Manufactured by Two companies over the Years (Number in Thousands)
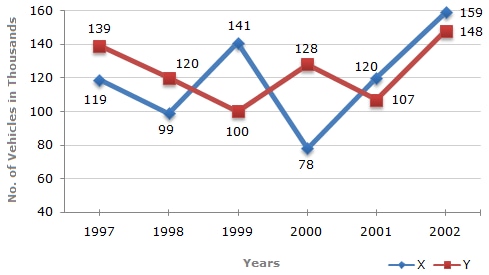
What is the average numbers of vehicles manufactured by Company X over the given period ? (rounded off to nearest integer)
- A.
119333
- B.
113666
- C.
112778
- D.
111223
Attempted by 4 students.
Show answer & explanation
Correct answer: A
Concept: The average (mean) of a set of values equals the sum of all the values divided by the number of values: Average = (Sum of all observations) / (Number of observations). When the data is presented as a line graph, first read every plotted value accurately before applying this formula.
Applying it to this graph:
Read Company X's (blue line) value for each year from the graph: 1997 = 119, 1998 = 99, 1999 = 141, 2000 = 78, 2001 = 120, 2002 = 159 (all figures in thousands).
Add all six yearly values: 119 + 99 + 141 + 78 + 120 + 159 = 716 (in thousands).
There are 6 years in the given period (1997 to 2002), so divide the total by 6: 716 ÷ 6 = 119.3333…
Convert back to actual vehicles and round to the nearest integer: 119.3333… thousand = 119,333.33…, which rounds to 119333.
Cross-check: Grouping the six values into three pairs and adding each pair gives 119 + 120 = 239, 99 + 141 = 240, and 78 + 159 = 237; these three partial sums add to 716, the same total obtained above, confirming the addition is correct.
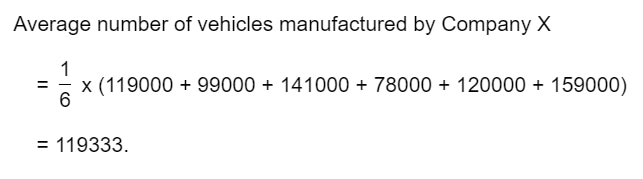
So the average number of vehicles manufactured by Company X over 1997–2002, rounded to the nearest integer, is 119333.