The following table gives the percentage of marks obtained by seven students…
2023
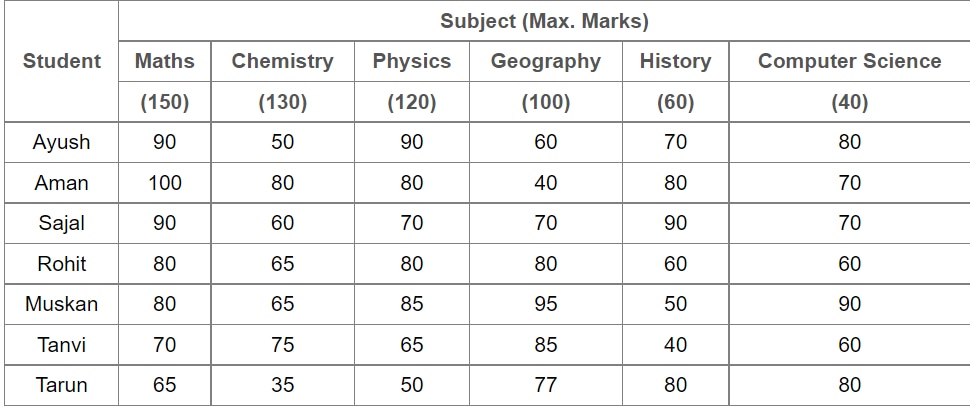
The following table gives the percentage of marks obtained by seven students in six different subjects in an examination. The Numbers in the Brackets give the Maximum Marks in Each Subject.
In which subject is the overall percentage the best?
- A.
Maths
- B.
Chemistry
- C.
Physics
- D.
History
Show answer & explanation
Correct answer: A
Concept: When several people attempt a subject for the same maximum marks, the subject's overall percentage is simply the arithmetic mean of everyone's individual percentages for that subject — since the denominator (maximum marks) is identical for every student in a column, only the numerators (the percentages) need to be averaged.
Application: Average each subject's column across all seven students (Ayush, Aman, Sajal, Rohit, Muskan, Tanvi, Tarun).
Subject | Sum of 7 percentages | Overall % (Sum ÷ 7) |
|---|---|---|
Maths | 90+100+90+80+80+70+65 = 575 | 82.14% |
Chemistry | 50+80+60+65+65+75+35 = 430 | 61.43% |
Physics | 90+80+70+80+85+65+50 = 520 | 74.29% |
Geography | 60+40+70+80+95+85+77 = 507 | 72.43% |
History | 70+80+90+60+50+40+80 = 470 | 67.14% |
Computer Science | 80+70+70+60+90+60+80 = 510 | 72.86% |
Cross-check: Restricting the comparison to only the four subjects offered as options — Maths, Chemistry, Physics and History — Maths' 82.14% still exceeds Chemistry's 61.43%, Physics' 74.29% and History's 67.14%, so narrowing to the choice list does not change the outcome.
Result: Maths has the best (highest) overall percentage among the seven students.