The bar graph below shows the production of paper (in lakh tonnes) by three…
2023
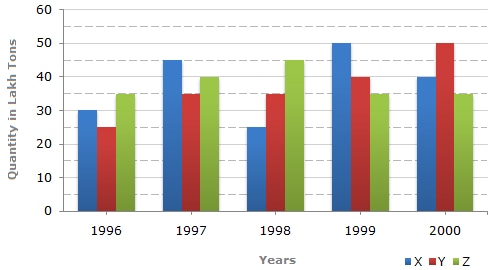
The bar graph below shows the production of paper (in lakh tonnes) by three companies — X, Y, and Z — over the years 1996 to 2000.
The average production over the five years was maximum for which company?
- A.
X
- B.
Y
- C.
Z
- D.
X and Z both
Attempted by 2 students.
Show answer & explanation
Correct answer: D
CONCEPT: The average of a set of values equals the sum of the values divided by the number of values. To find which company has the maximum production over several years, compute each company's average by summing its yearly values and dividing by the number of years, then compare the averages — more than one company can tie for the maximum.
The values read from the bar graph for each year are:
Year | X | Y | Z |
|---|---|---|---|
1996 | 30 | 25 | 35 |
1997 | 45 | 35 | 40 |
1998 | 25 | 35 | 45 |
1999 | 50 | 40 | 35 |
2000 | 40 | 50 | 35 |
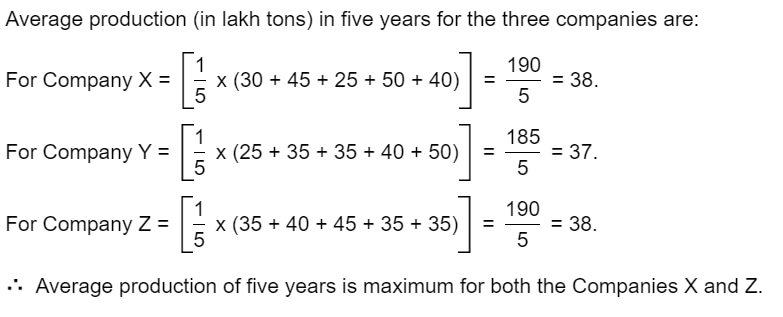
Sum each company's five yearly values: X = 30 + 45 + 25 + 50 + 40 = 190; Y = 25 + 35 + 35 + 40 + 50 = 185; Z = 35 + 40 + 45 + 35 + 35 = 190.
Divide each sum by the number of years (5) to get the average production: Average(X) = 190 ÷ 5 = 38 lakh tonnes; Average(Y) = 185 ÷ 5 = 37 lakh tonnes; Average(Z) = 190 ÷ 5 = 38 lakh tonnes.
Compare the three averages to find the maximum: 38 (X), 37 (Y), 38 (Z) — the highest value, 38, is reached by two companies.
CROSS-CHECK: X's own five values (30, 45, 25, 50, 40) and Z's own five values (35, 40, 45, 35, 35) each sum to exactly 190 — the same total — so their averages are exactly equal rather than only approximately close, confirming the tie is genuine and not a rounding coincidence.
Therefore, the average production over the five years was maximum for Company X and Company Z both.