The following bar graph shows the percentage breakup of a Sunil's salary from…
2025
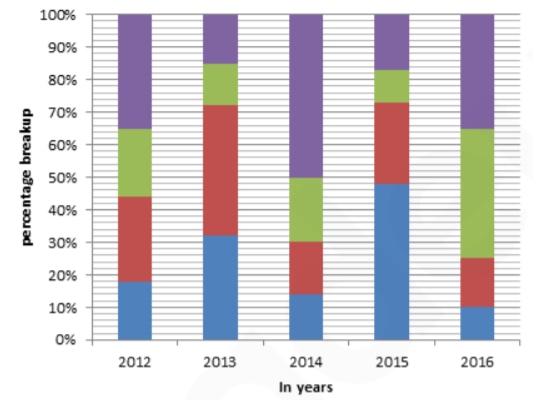
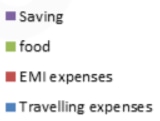
The following bar graph shows the percentage breakup of a Sunil's salary from year 2012 to 2016. With the given information, find the following questions.
If the ratio on saving in the year 2013 and 2016 are in the ratio 3 : 5. Then what is the ratio of EMI expenses in the year 2013 and 2016. [ Question no 1 till 5 are linked together]
Answer: C. 56:15 — When a quantity is given as a percentage of a total that itself differs from year to year, the actual amount in a year equals (percentage) times (that year's…
- A.
56:5
- B.
8:15
- C.
56:15
- D.
Can't be determined
Attempted by 13 students.
Show answer & explanation
Correct answer: C
When a quantity is given as a percentage of a total that itself differs from year to year, the actual amount in a year equals (percentage) times (that year's total). So if the actual-amount ratio of one such quantity across two years is known, the ratio of the two years' totals can be recovered - and that total-ratio can then be used to convert any other year-wise percentage into an actual-amount ratio.
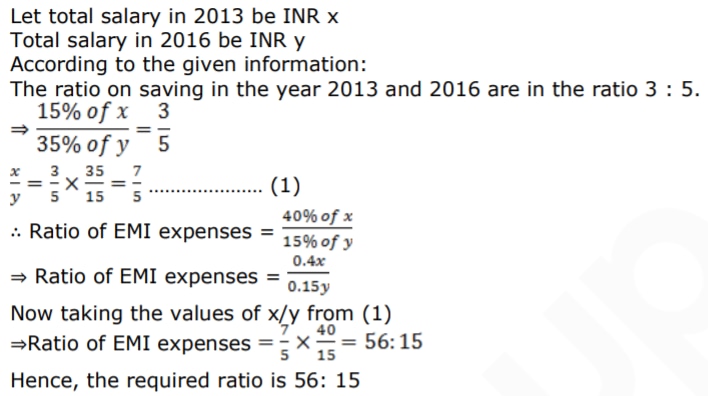
Let the total salary in 2013 be x and in 2016 be y.
From the graph: Savings = 15% of salary in 2013, and 35% of salary in 2016.
Given: Savings(2013) : Savings(2016) = 3 : 5, so (15% of x) / (35% of y) = 3/5.
Solving, x/y = (3/5) x (35/15) = 7/5, i.e. the ratio of the 2013 salary to the 2016 salary is 7 : 5.
From the graph: EMI expenses = 40% of salary in 2013, and 15% of salary in 2016.
So the EMI ratio = (40% of x) / (15% of y) = (x/y) x (40/15) = (7/5) x (8/3) = 56/15.
Cross-check by taking x = 7k and y = 5k: Savings(2013) = 0.15 x 7k = 1.05k and Savings(2016) = 0.35 x 5k = 1.75k, giving 1.05 : 1.75 = 3 : 5 - matches the given condition. EMI(2013) = 0.40 x 7k = 2.8k and EMI(2016) = 0.15 x 5k = 0.75k, giving 2.8 : 0.75 = 56 : 15 - confirming the same result.
Hence, the ratio of EMI expenses in 2013 and 2016 is 56 : 15.