Observe the following graph and find the missing statement in the Python code.
2023
Observe the following graph and find the missing statement in the Python code.
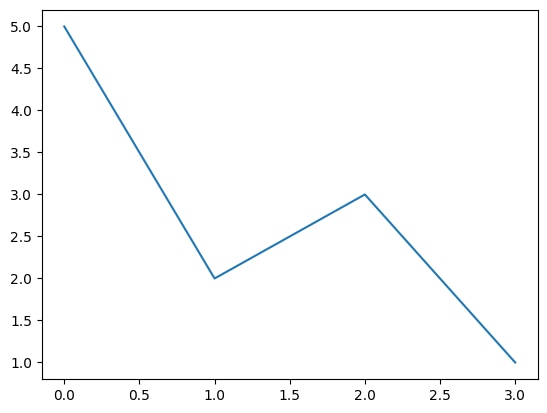
Answer: C. pl.plot([5, 2, 3, 1]) — Answer: Use pl.plot([5, 2, 3, 1]). Explanation: The shown graph is a line graph that connects the data points. pl.plot draws a line by default when given a…
- A.
pl.bar([5, 2, 3, 1])
- B.
pl.scatter([5, 2, 3, 1])
- C.
pl.plot([5, 2, 3, 1])
- D.
pl.line([5, 2, 3, 1])
Attempted by 1168 students.
Show answer & explanation
Correct answer: C
Answer: Use pl.plot([5, 2, 3, 1]). Explanation: The shown graph is a line graph that connects the data points. pl.plot draws a line by default when given a single list of y-values (x values are taken as 0, 1, 2, ...). pl.bar([5, 2, 3, 1]) creates a bar chart (bars), not a connected line.
Loading lesson…