Which of the following graph indicates the graph of {(sin t, cos t):- π/2 ≤ t…
2023
Which of the following graph indicates the graph of {(sin t, cos t):- π/2 ≤ t ≤ 0} in xy-plane ?
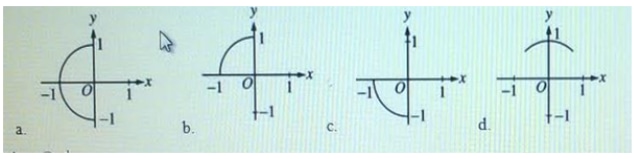
Answer: D. b — Solution: Determine the curve and its endpoints. Parametrisation: x = sin t, y = cos t. Endpoints: for t = -π/2, (x,y) = (−1,0); for t = 0, (x,y) = (0,1). All…
- A.
d
- B.
c
- C.
a
- D.
b
Attempted by 3 students.
Show answer & explanation
Correct answer: D
Solution: Determine the curve and its endpoints.
Parametrisation: x = sin t, y = cos t.
Endpoints: for t = -π/2, (x,y) = (−1,0); for t = 0, (x,y) = (0,1).
All points satisfy x² + y² = sin²t + cos²t = 1, so the curve lies on the unit circle.
Range -π/2 ≤ t ≤ 0 traces the quarter-circle in the second quadrant between (−1,0) and (0,1).
Conclusion: choose the graph that shows the quarter of the unit circle in the upper-left (second) quadrant connecting (−1,0) to (0,1).