DIRECTIONS : Study the following graph and answer the questions that follow.…
2025
DIRECTIONS : Study the following graph and answer the questions that follow.
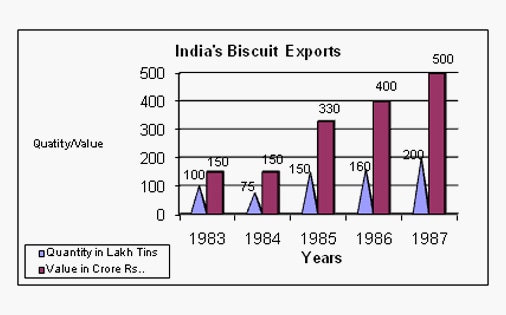
In which year was the value per tin the minimum?
Answer: D. 1983 — Step-by-Step SolutionTo determine the year with the minimum value per tin, we need to calculate the ratio of Value (in Crore Rs.) to Quantity (in Lakh Tins)…
- A.
1987
- B.
1984
- C.
1985
- D.
1983
Attempted by 208 students.
Show answer & explanation
Correct answer: D
Step-by-Step Solution
To determine the year with the minimum value per tin, we need to calculate the ratio of Value (in Crore Rs.) to Quantity (in Lakh Tins) for each year provided in the graph.
Extract Data and Calculate Ratios:
1983: Value = 150, Quantity = 100. Ratio = 150 / 100 = 1.5
1984: Value = 150, Quantity = 75. Ratio = 150 / 75 = 2.0
1985: Value = 330, Quantity = 150. Ratio = 330 / 150 = 2.2
1986: Value = 400, Quantity = 160. Ratio = 400 / 160 = 2.5
1987: Value = 500, Quantity = 200. Ratio = 500 / 200 = 2.5
Compare Results: Comparing the calculated ratios (1.5, 2.0, 2.2, 2.5, 2.5), the minimum value is 1.5, which corresponds to the year 1983.