The following bar graph shows the percentage breakup of a Sunil’s salary from…
PYQ Accenture 2025PYQ Infosys 2025PYQ Hexaware 2024PYQ Cognizant 2025PYQ CO-CUBES 2025
The following bar graph shows the percentage breakup of a Sunil’s salary from year 2012 to 2016. With the given information, find the following questions.
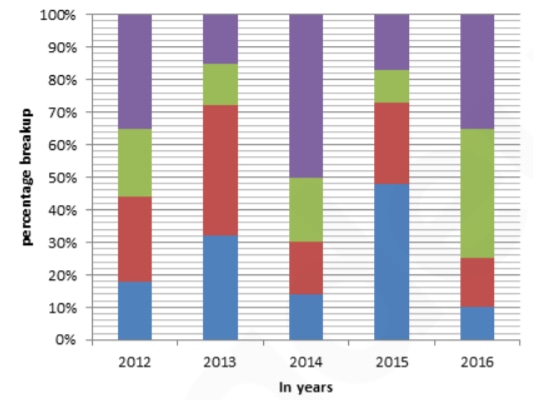
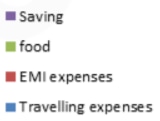
If the total expenses in year 2011 is INR 3, 00,000 and there is an increase of 18% in 2012. Then how much Sunil has spent on travelling and EMI combine in 2012?
- A.
INR 1,53,740
- B.
INR 1, 55,760
- C.
INR 1,50,740
- D.
INR 92,400
Attempted by 13 students.
Sign up free to check your answer
Sign up freeLoading lesson…