The following bar graph shows the percentage breakup of a Sunil’s salary from…
PYQ Accenture 2025PYQ Infosys 2025PYQ Hexaware 2024PYQ Cognizant 2025PYQ CO-CUBES 2025
The following bar graph shows the percentage breakup of a Sunil’s salary from year 2012 to 2016. With the given information, find the following questions.
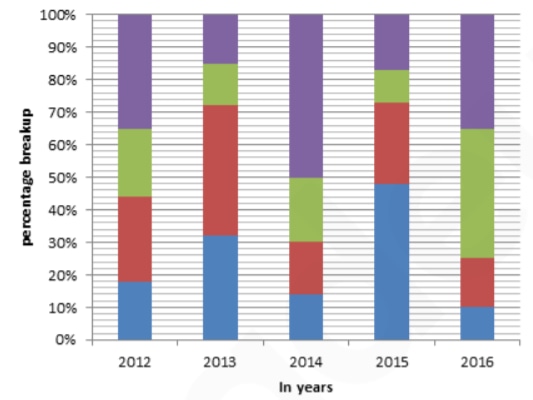
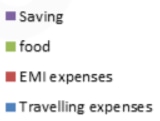
If the ratio on saving in the year 2013 and 2016 are in the ratio 3 : 5. Then what is the ratio of EMI expenses in the year 2013 and 2016.
- A.
56:5
- B.
8:15
- C.
56:15
- D.
Can’t be determined
Attempted by 15 students.
Sign up free to check your answer
Sign up freeLoading lesson…