The following bar graph shows the percentage breakup of a Sunil’s salary from…
PYQ Accenture 2024PYQ Infosys 2025PYQ Hexaware 2023PYQ Cognizant 2025PYQ CO-CUBES 2024
The following bar graph shows the percentage breakup of a Sunil’s salary from year 2012 to 2016. With the given information, find the following questions.
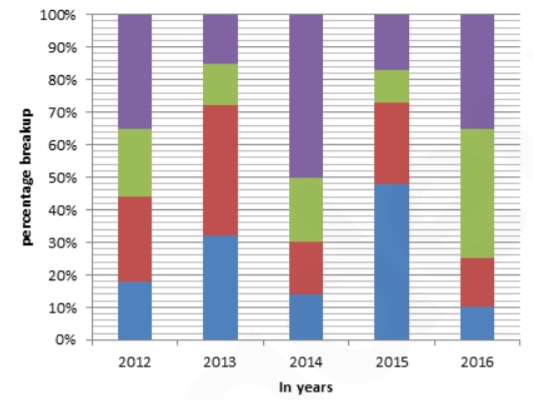
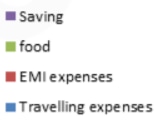
If the saving in 2012 is 4/5th of the saving in 2014. Then what is the total expenditure spent on food in 2012. (Given that total expense in 2014 is INR 1,85,000)
- A.
INR 40,400
- B.
INR 44,400
- C.
INR 21,100
- D.
INR 45,100
Attempted by 16 students.
Sign up free to check your answer
Sign up freeLoading lesson…