Directions : The charts given below represents data of number of students of…
IBPS · 2021
Directions : The charts given below represents data of number of students of four colleges P, Q, R and S. Based on the information given below, answer the questions that follow:
Note: 1. Number of girls in college Q is 10.
2. Difference between number of boys and girls in college P is 100. (Number of boys is greater than number of girls).
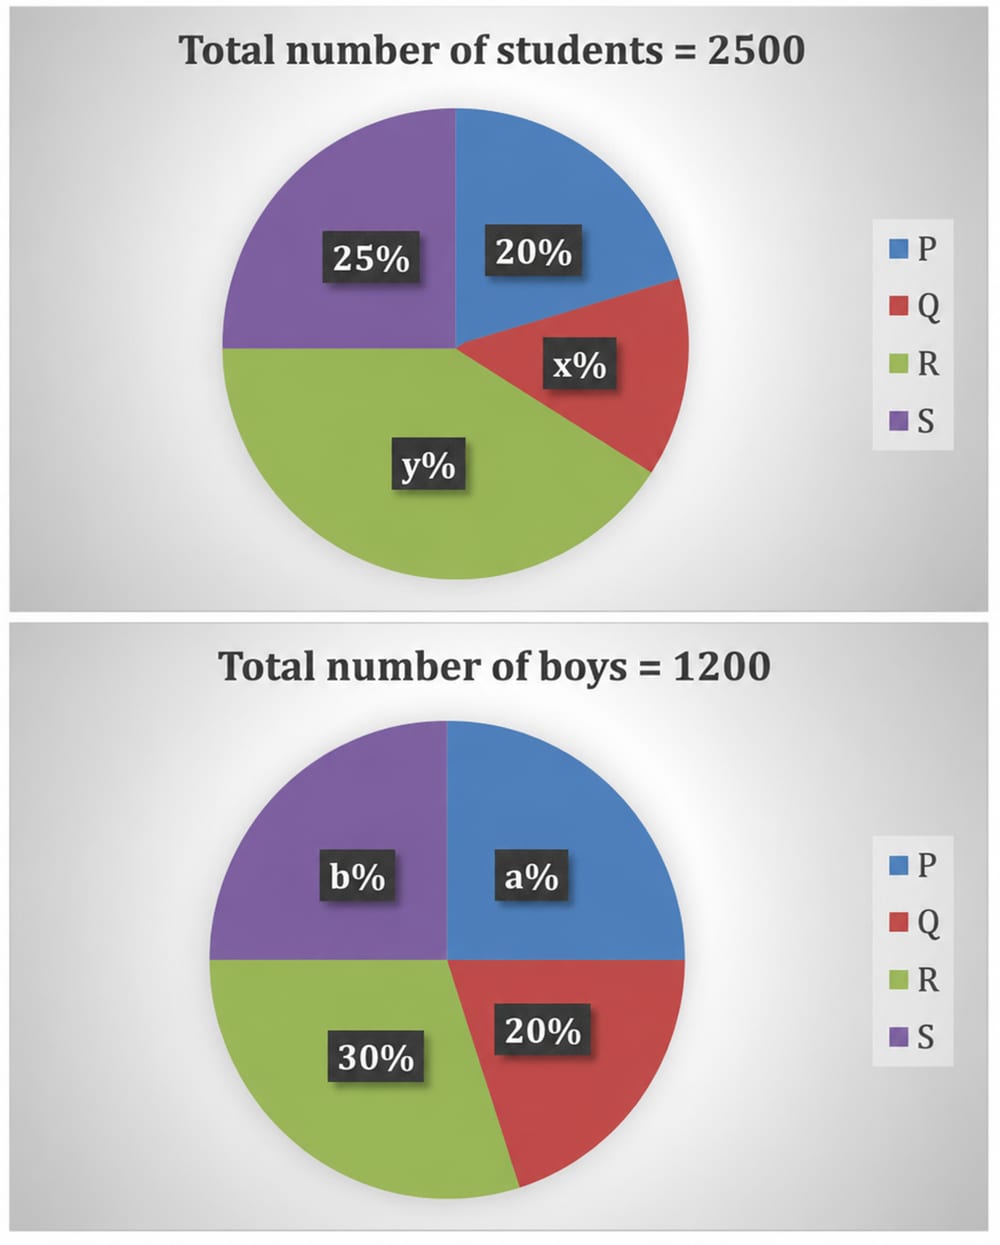
If 10% of boys from school S scored more than 90% in an exam, then find maximum number of boys who scored less than 90%.
- A.
240
- B.
200
- C.
270
- D.
250
- E.
220
Attempted by 11 students.
Show answer
Correct answer: C
Loading lesson…