Directions : Read the pie chart carefully and answer the following question.…
IBPS · 2023
Directions : Read the pie chart carefully and answer the following question.
Pie chart given below shows the percentage distribution of questions attempted by four different (A, B, C and D) students in an exam. Exam contains three subjects English, History and Mathematics which consist of 120, 60 and 100 questions respectively.
Maximum number of questions attempted by each student is 240 and total number of questions attempted by all the students is 800.
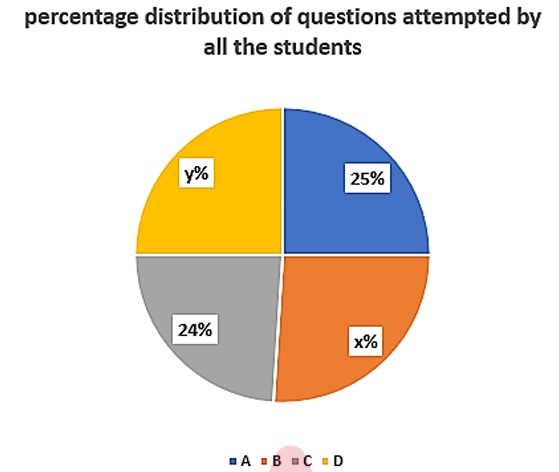
For each incorrect question one mark is deducted and for each right answer two marks is given. If A attempted 30% of the total questions attempted by him in History and gained 66 marks from History, then find the number of incorrect questions attempted by A in History.
- A.
18
- B.
15
- C.
20
- D.
None of these
- E.
42
Attempted by 12 students.
Show answer
Correct answer: A