Directions : Read the following pie charts carefully and answer the questions…
IBPS · 2022
Directions : Read the following pie charts carefully and answer the questions given below.
Pie charts (i) shows percentage distribution of runs scored by three (P, Q & R) different batsmen in a match and pie chart (ii) shows percentage distribution of balls faced by each batsman in a match.
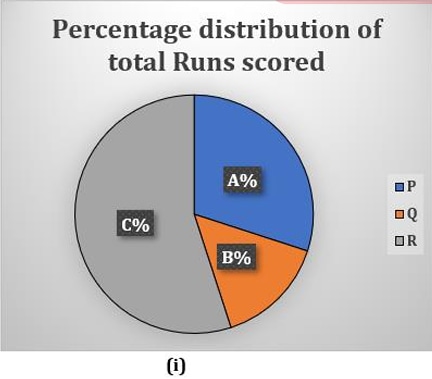
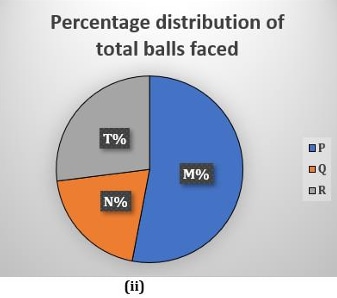
Note: (I) Strike rate of P is 25.
(II) Balls faced by Q is 180 and his strike rate is 33 ⅓.
(III) Had P faced the same number of balls Q faced, but scored same number of runs as he scored initially, then his strike rate would have been double that of Q.
(IV) Balls faced by R is half of the balls faced by P.
(V) Strike rate = (Total runs scored / Total balls faced) × 100.
(VI) Central angle of runs scored by R is 198°.
Find the difference between the central angle of runs scored by P and the central angle of balls faced by Q.
- A.
36°
- B.
48°
- C.
18°
- D.
54°
- E.
12°
Attempted by 13 students.
Show answer
Correct answer: A