Directions: The line graph shows the percentage of people using debit card to…
IBPS · 2023
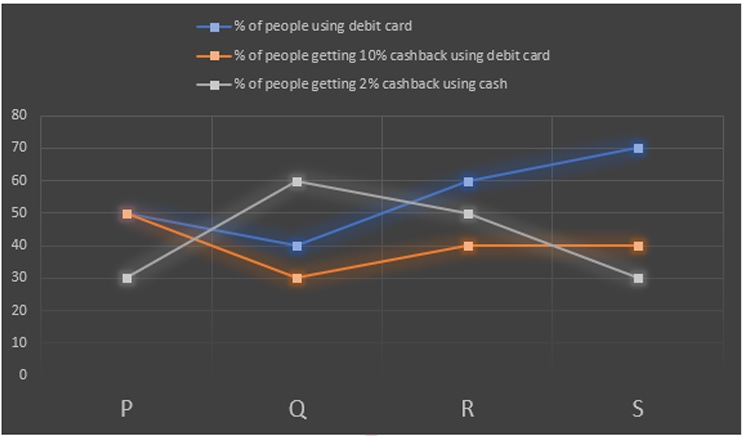
Directions: The line graph shows the percentage of people using debit card to pay the bill, percentage of people getting 10% cashback using debit card out of the total people using debit card for payment, percentage of people getting 2% cashback using cash payments out of the total people using cash for payment while paying their bills either through debit card or cash only in four different restaurants (P, Q, R and S) on any day. Read the line graph carefully and answer the following questions.
Note: (i) Cash back is given to customers in the given manner.
1. Debit card users get 10% cashback
2. Cash payments users get 2 % cashback
(ii) Total people who paid bill using debit card = number of people getting 10% discount + number of people did not get any discount using debit card
(iii) Total people who paid bill using cash = number of people getting 2% discount + number of people did not get any discount using cash
Total 3000 people went to restaurant R. Find the difference between the number of customers who are getting 10% cashback and the number of customers who are using cash payments.
- A.
480
- B.
460
- C.
590
- D.
500
- E.
None of these
Attempted by 11 students.
Show answer
Correct answer: A