Read the following line graph carefully and answer the questions given below.…
IBPS · 2024
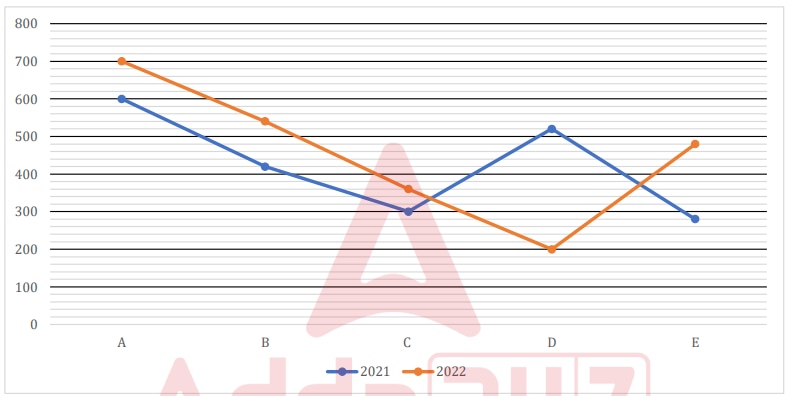
Read the following line graph carefully and answer the questions given below. The line graph shows 1/3rd of the total items sold by five different shops in two different years.
Note:
(i). Total number of items sold by each shops in 2023 is 20% more than that in 2021.
(ii). The total number of items sold by each shops in each year, which is given in the line graph, is one-third of the total items sold.
Total number of items sold by D in 2023 is what percentage less than the total number of items sold by A in 2022 (approx.)?
- A.
23%
- B.
19%
- C.
11%
- D.
15%
- E.
8%
Attempted by 11 students.
Show answer
Correct answer: C
Loading lesson…