The line graph given below shows the total number of TV sold and difference…
IBPS · 2025
The line graph given below shows the total number of TV sold and difference between cell phone and TV sold by five different shops (A, B, C, D and E).
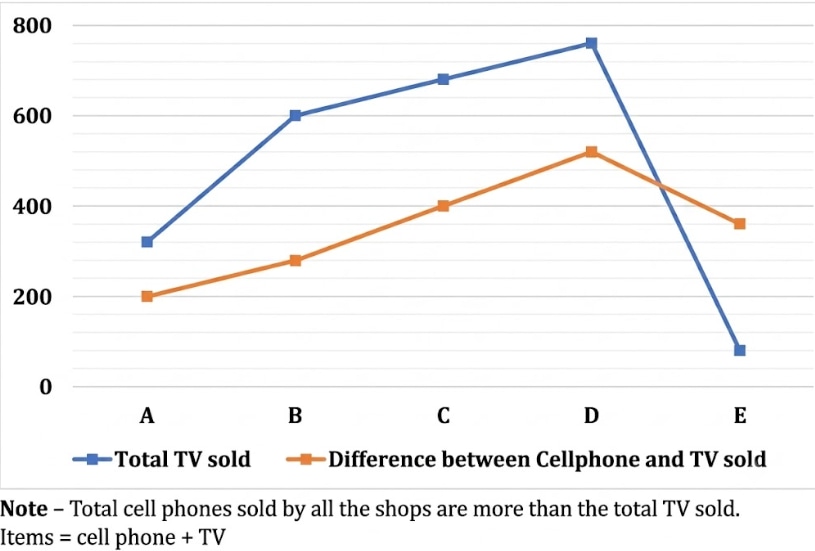
If 12.5% of TV sold by D are defective and total items sold by D that are defective is 280. Find the defective cell phones sold by D.
- A.
185
- B.
120
- C.
100
- D.
180
- E.
186
Attempted by 21 students.
Show answer
Correct answer: A
Loading lesson…