The total revenue of a company during 2014−2018 is shown in the bar graph. If…
2020
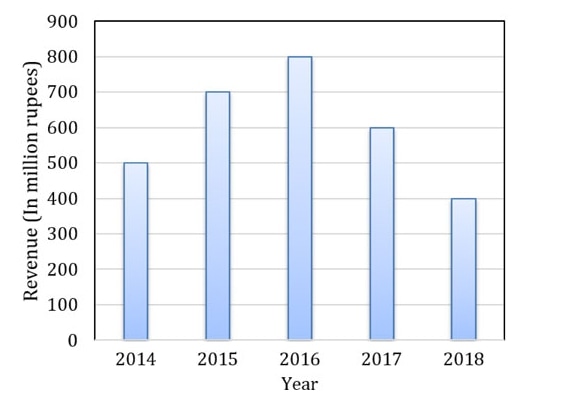
The total revenue of a company during 2014−2018 is shown in the bar graph. If the total expenditure of the company in each year is 500 million rupees, then the aggregate profit or loss (in percentage) on the total expenditure of the company during 2014−2018 is _________ .
- A.
16.67% profit
- B.
16.67% loss
- C.
20% profit
- D.
20% loss
Attempted by 119 students.
Show answer & explanation
Correct answer: C
Step 1: Read values from the graph (in million rupees): 2014 = 500, 2015 = 700, 2016 = 800, 2017 = 600, 2018 = 400.
Step 2: Compute total revenue over 2014–2018:
Total revenue = 500 + 700 + 800 + 600 + 400 = 3000 million rupees.
Step 3: Compute total expenditure for five years:
Total expenditure = 5 × 500 = 2500 million rupees.
Step 4: Find aggregate profit and its percentage on total expenditure.
Aggregate profit = Total revenue − Total expenditure = 3000 − 2500 = 500 million rupees.
Profit percentage = (Aggregate profit / Total expenditure) × 100 = (500 / 2500) × 100 = 20%.
Answer: 20% profit.
A video solution is available for this question — log in and enroll to watch it.