The line graph below shows the total number of TVs sold and the difference…
2025
The line graph below shows the total number of TVs sold and the difference between cell phones and TVs sold by five different shops (A, B, C, D and E). Note: for every shop the total cell phones sold is more than the total TVs sold, so cell phones sold = TVs sold + difference.
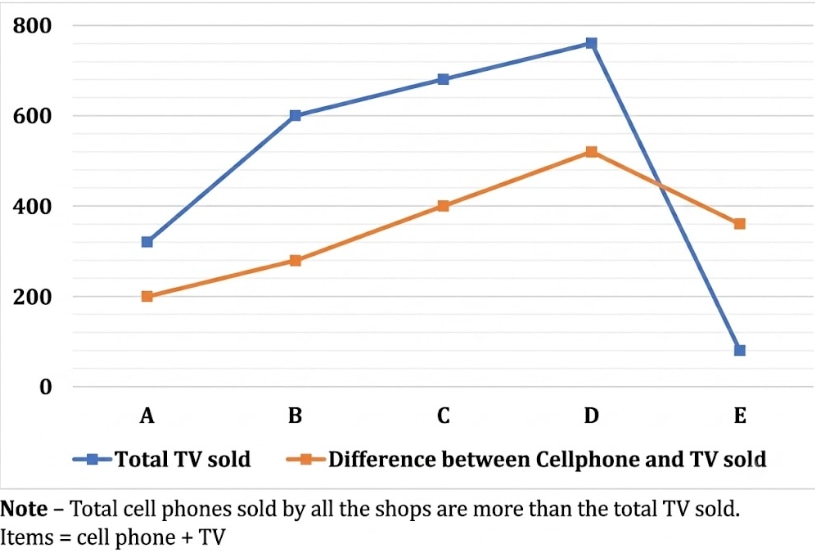
Find the average number of cell phones sold by shops B, C and E.
Answer: D. 800 — ConceptAn average is the sum of the quantities divided by how many there are: Average = (sum of values) / (number of values). Here the cell-phone sales are…
- A.
900
- B.
720
- C.
400
- D.
800
- E.
720
Attempted by 12 students.
Show answer & explanation
Correct answer: D
Concept
An average is the sum of the quantities divided by how many there are: Average = (sum of values) / (number of values). Here the cell-phone sales are not plotted directly — the graph gives TVs sold and the cell-phone-minus-TV difference. The note says cell phones exceed TVs at every shop, so for each shop: cell phones sold = TVs sold + difference.
Application
Read the two graph values for each required shop — Shop B: TVs = 600, difference = 280; Shop C: TVs = 680, difference = 400; Shop E: TVs = 80, difference = 360.
Reconstruct cell phones with cell phones = TVs + difference — Shop B: 600 + 280 = 880; Shop C: 680 + 400 = 1080; Shop E: 80 + 360 = 440.
Add the three cell-phone totals: 880 + 1080 + 440 = 2400.
Divide by the number of shops (3): 2400 / 3 = 800.
Cross-check
The three totals 880, 1080 and 440 are balanced around 800, and their sum 2400 is exactly divisible by 3, so the average is the clean value 800.