

Read the following line graph carefully and answer the question given below.…
PYQ IBPS 2024 (paper not recorded)
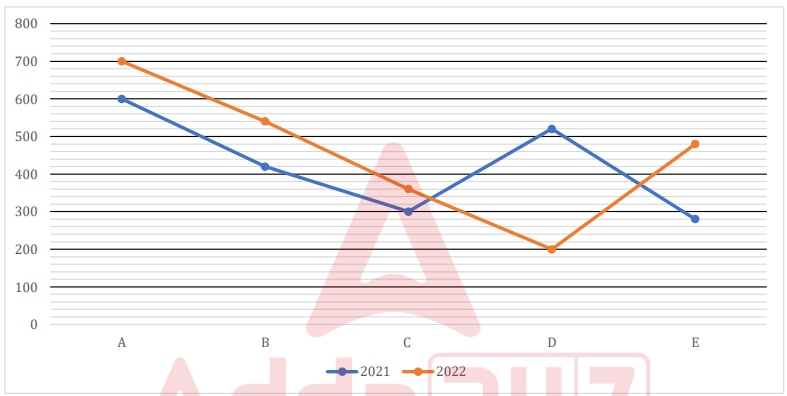
Read the following line graph carefully and answer the question given below. The line graph shows one-third of the total items sold by five different shops in two different years.
Note:
(i). The total number of items sold by each shop in 2023 is 20% more than that in 2021.
(ii). The number of items shown in the line graph for each shop in each year is one-third of the total items sold by that shop.
Find the ratio of the total number of items sold by B in 2022 to the total number of items sold by C in 2023.
- A.
1:2
- B.
2:3
- C.
3:2
- D.
3:4
- E.
4:5
Attempted by 10 students.
Sign up free to check your answer
Sign up freeLoading lesson…