The bar graph below shows the amount of tax (in '000) paid by three people,…
IBPS · 2022
The bar graph below shows the amount of tax (in '000) paid by three people, Tarun, Apurv and Mayank, in the years 2018 and 2019. Study the data carefully and answer the question.
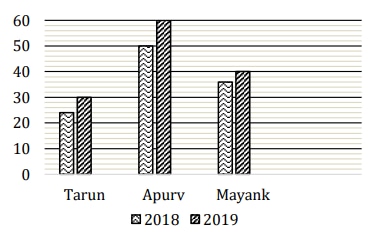
Find the difference between the total tax paid by Apurv in both years and the total tax paid by Mayank and Tarun in 2019.
- A.
35000 Rs.
- B.
20000 Rs.
- C.
50000 Rs.
- D.
40000 Rs.
- E.
30000 Rs.
Attempted by 122 students.
Show answer
Correct answer: D
Loading lesson…