Directions : first bar graph shows total sales amount of three different…
IBPS · 2019
Directions : first bar graph shows total sales amount of three different companies in three different years and second bar graph shows the combined target sales amount of these 3 companies in these 3 years.
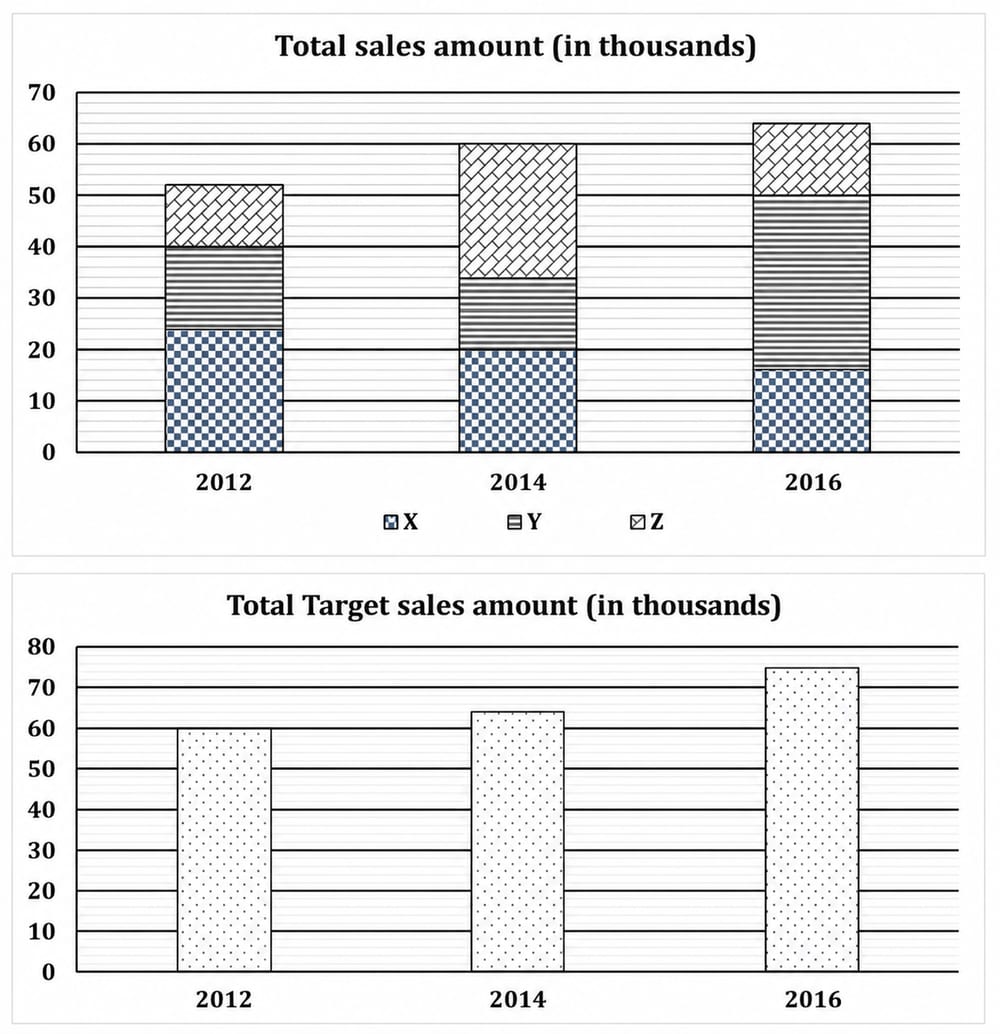
If sales amount of company X and Y in 2012 increases by 20% and 25% respectively and sales amount of company Z remains constant, then find the difference between total target sales amount of all these companies in 2012 and sales amount of these 3 companies together as per the above condition?(in Rs.)
- A.
800
- B.
8000
- C.
8800
- D.
6000
- E.
3000
Attempted by 11 students.
Show answer
Correct answer: A
Loading lesson…