Direction : The Line graph shows the number of people (Boys + girls) visited…
IBPS · 2020
Direction : The Line graph shows the number of people (Boys + girls) visited five (A, B, C, D & E) different parks and the number of girls visited out of total people visited these five parks. Read the data carefully and answer the questions.
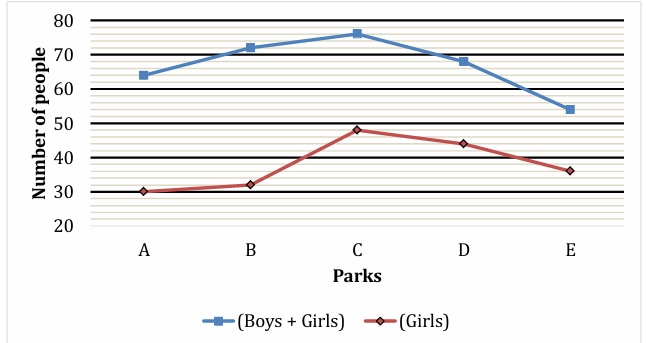
Total people (Boys + Girls) who visited park B is what percent more than total people (Boys + Girls) who visited park E (Approximate)?
- A.
25%
- B.
39%
- C.
43%
- D.
33%
- E.
66%
Attempted by 21 students.
Show answer
Correct answer: D
Loading lesson…