Direction : The Line graph shows the number of people (Boys + Girls) who…

2020

Direction : The Line graph shows the number of people (Boys + Girls) who visited five (A, B, C, D & E) different parks and the number of girls who visited out of the total people who visited these five parks. Read the data carefully and answer the questions.
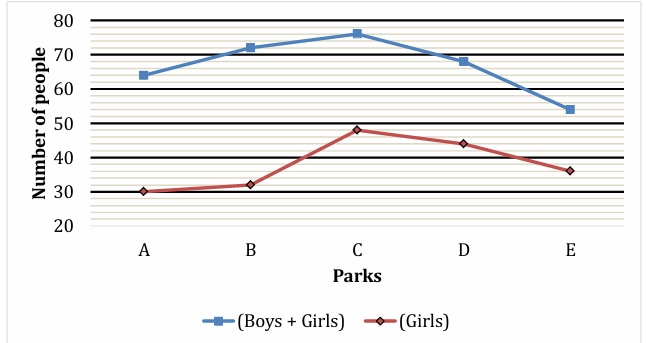
image.png

If park E charges Rs. 24 for each person (Boys + Girls) who visited the park, then find the total revenue earned by park E.

Answer: B. 1296 Rs.ConceptRevenue from a flat per-head ticket charge = (charge per person) × (number of people who visited). For a Data Interpretation line graph, the number of…

  1. A.

    1166 Rs.

  2. B.

    1296 Rs.

  3. C.

    1248 Rs.

  4. D.

    1268 Rs.

  5. E.

    1284 Rs.

Attempted by 2 students.

Show answer & explanation

Correct answer: B

Concept

Revenue from a flat per-head ticket charge = (charge per person) × (number of people who visited). For a Data Interpretation line graph, the number of people is read directly off the correct series at the labelled point — here the upper line, "(Boys + Girls)", which is the TOTAL number of people.

Applying it to park E

  1. Identify the value to multiply: the charge applies to every person (Boys + Girls), so use the total-people series, not the girls-only series.

  2. Read park E on the "(Boys + Girls)" line: the marker sits at 54 people.

  3. Apply the revenue rule: total revenue = 24 × 54.

Cross-check

Cross-check the product: 24 × 54 = 24 × 50 + 24 × 4 = 1200 + 96 = 1296. So park E collects Rs. 1296.

Explore the full course: Ibps Clerk Csa Mains

Loading lesson…