

Study the following graph showing the number of females in different…
PYQ DSSSB 2018Modified — slightly modified from the official paper; see the solution
Study the following graph showing the number of females in different departments of a company and table and answer questions .
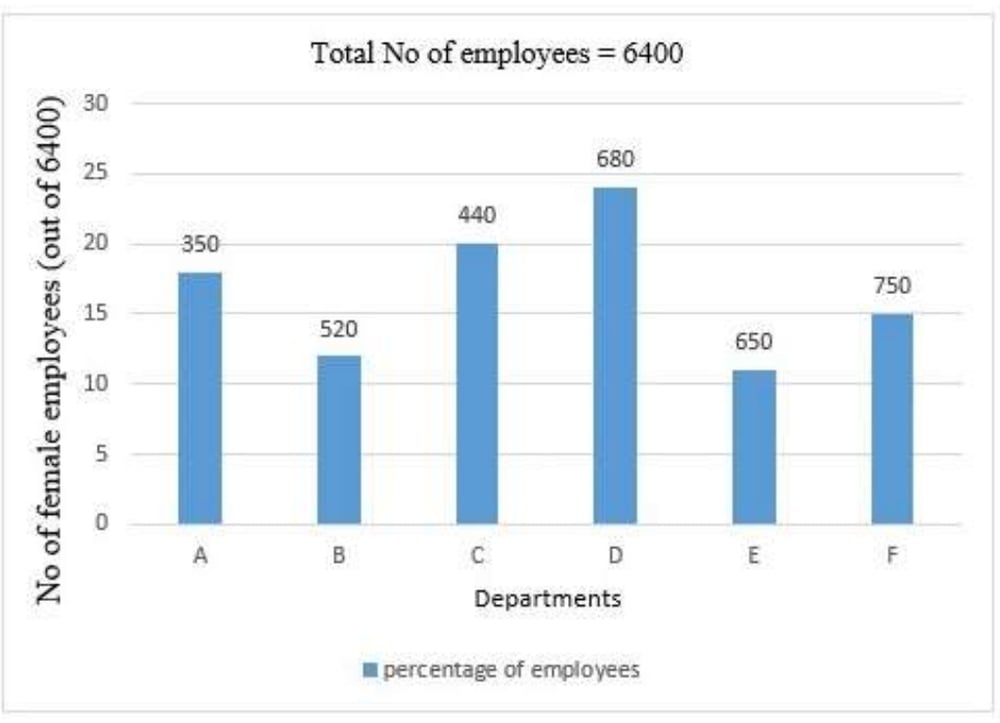
Department | Percentage of employees |
|---|---|
A | 18 |
B | 12 |
C | 20 |
D | 24 |
E | 11 |
F | 15 |
What is the ratio of total number of male employees in A, B and C to the total number of female employees in B, D and F?
- A.
65 : 42
- B.
42 : 65
- C.
63 : 65
- D.
65 : 63
Attempted by 22 students.
Sign up free to check your answer
Sign up freeLoading lesson…