

Study the graph and table and answer the questions below. School Percentage of…
PYQ DSSSB 2018
Study the graph and table and answer the questions below.
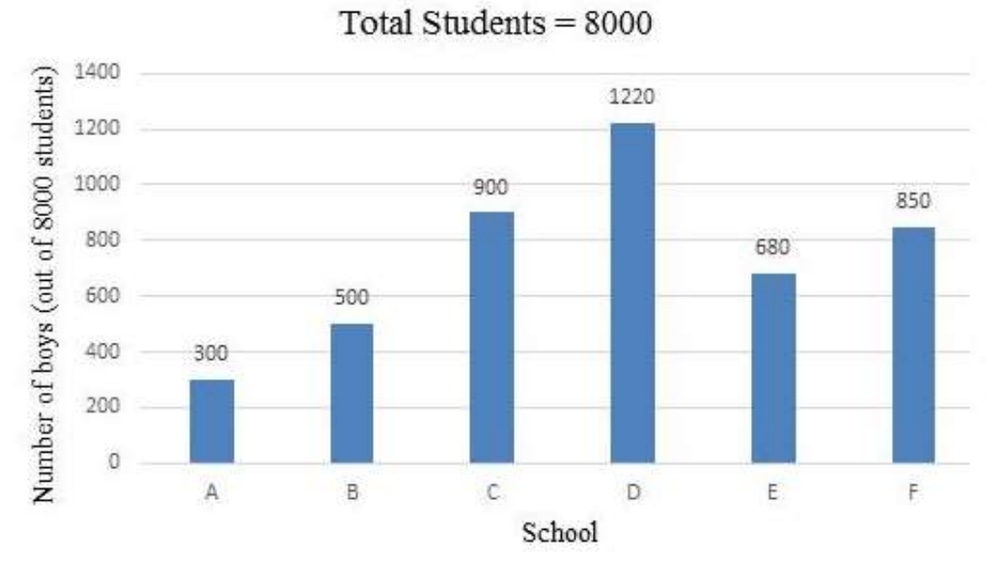
School | Percentage of Students |
|---|---|
A | 12 |
B | 10 |
C | 25 |
D | 20 |
E | 15 |
F | 18 |
In how many schools the number of boys is more than the average number of girls in all the schools?
- A.
1
- B.
2
- C.
3
- D.
4
Attempted by 24 students.
Sign up free to check your answer
Sign up freeLoading lesson…