

Study the following bar graph that shows he number of students from two…
PYQ DSSSB 2018Modified — slightly modified from the official paper; see the solution
Study the following bar graph that shows he number of students from two schools who qualified in an examination in six years and he take and answer questions.
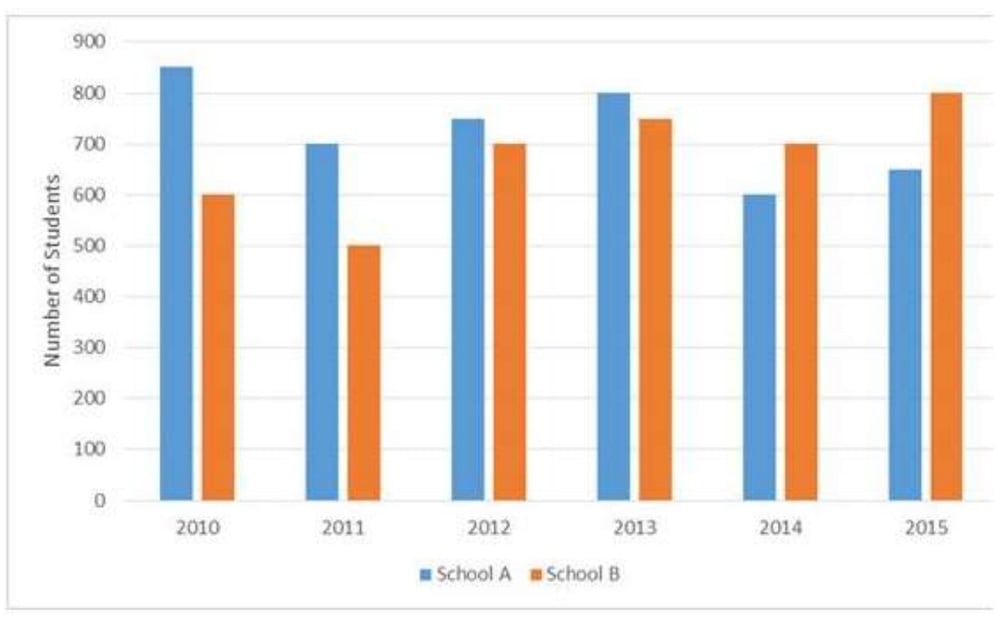
Percentage of (among who qualified)
Year | Boys (in A) | Girls (in B) |
|---|---|---|
2010 | 48 | 56 |
2011 | 66 | 60 |
2012 | 72 | 45 |
2013 | 42 | 48 |
2014 | 57 | 81 |
2015 | 36 | 54 |
Total number of girls qualified in the examination from school B in six years is what percentage of the number of students qualified from A in six years: (nearest to an integer)
- A.
51
- B.
53
- C.
54
- D.
61
Attempted by 23 students.
Sign up free to check your answer
Sign up freeLoading lesson…