

The following chart shows information about the sales of the company ‘XYZ’ for…
PYQ DSSSB 2018Modified — slightly modified from the official paper; see the solution
The following chart shows information about the sales of the company ‘XYZ’ for the year 2016 & 2017.
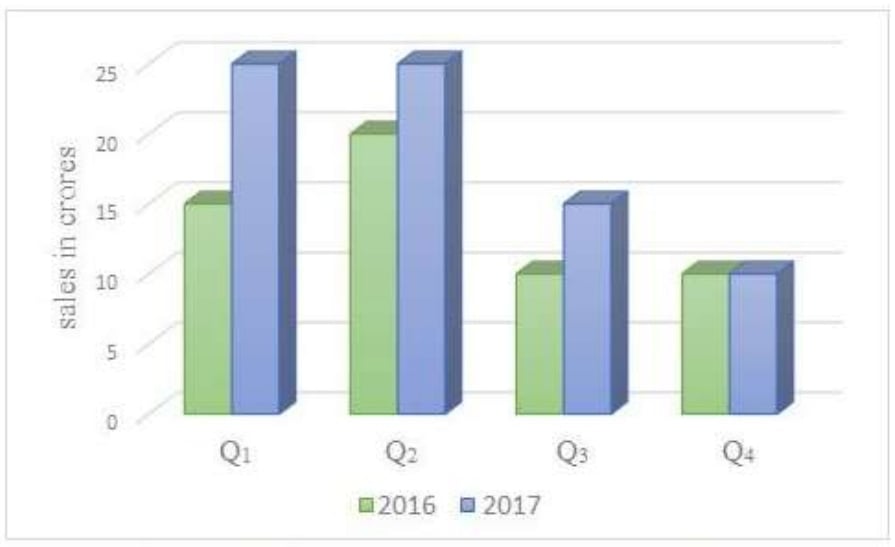
What is the ratio of the sales of the company ‘XYZ’ for the quarter 2 (Q2) of 2016 to the sales of the company for quarter 2 (Q2) of 2017?
- A.
4 : 5
- B.
4 : 3
- C.
5 : 5
- D.
3 : 4
Attempted by 79 students.
Sign up free to check your answer
Sign up freeLoading lesson…