The following graphs show the classification of appeared candidates and…
TCS · 2026
The following graphs show the classification of appeared candidates and qualified candidates from different states in a competitive test. Study the graphs and answer the question below.
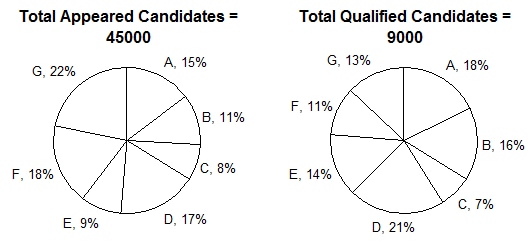
What is the ratio between the number of appeared candidates from states C and E together and the appeared candidates from states A and F together?
- A.
17 : 33
- B.
11 : 13
- C.
13 : 27
- D.
17 : 27
Attempted by 120 students.
Sign up free to check your answer
Sign up freeLoading lesson…