The following line graph gives the percentage of the number of candidates who…
TCS · 2025
The following line graph gives the percentage of the number of candidates who qualified an examination out of the total number of candidates who appeared for the examination over a period of seven years from 1994 to 2000.
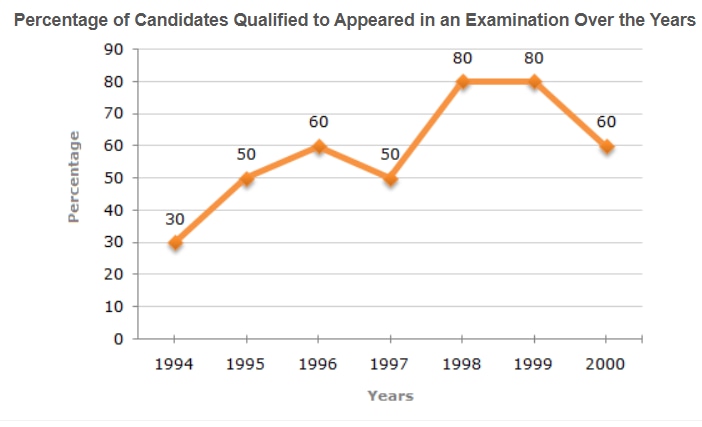
In which pair of years was the number of candidates qualified, the same?
- A.
1995 and 1997
- B.
1995 and 2000
- C.
1998 and 1999
- D.
Data inadequate
Attempted by 676 students.
Sign up free to check your answer
Sign up freeLoading lesson…