

Direction: Line graph given below shows percentage of managers out of total…
PYQ IBPS 2020 (paper not recorded)
Direction: Line graph given below shows percentage of managers out of total employees in six (A, B, C, D, E & F) different companies and table shows number of female managers out of total managers in these six companies. Read the data carefully and answer the questions.
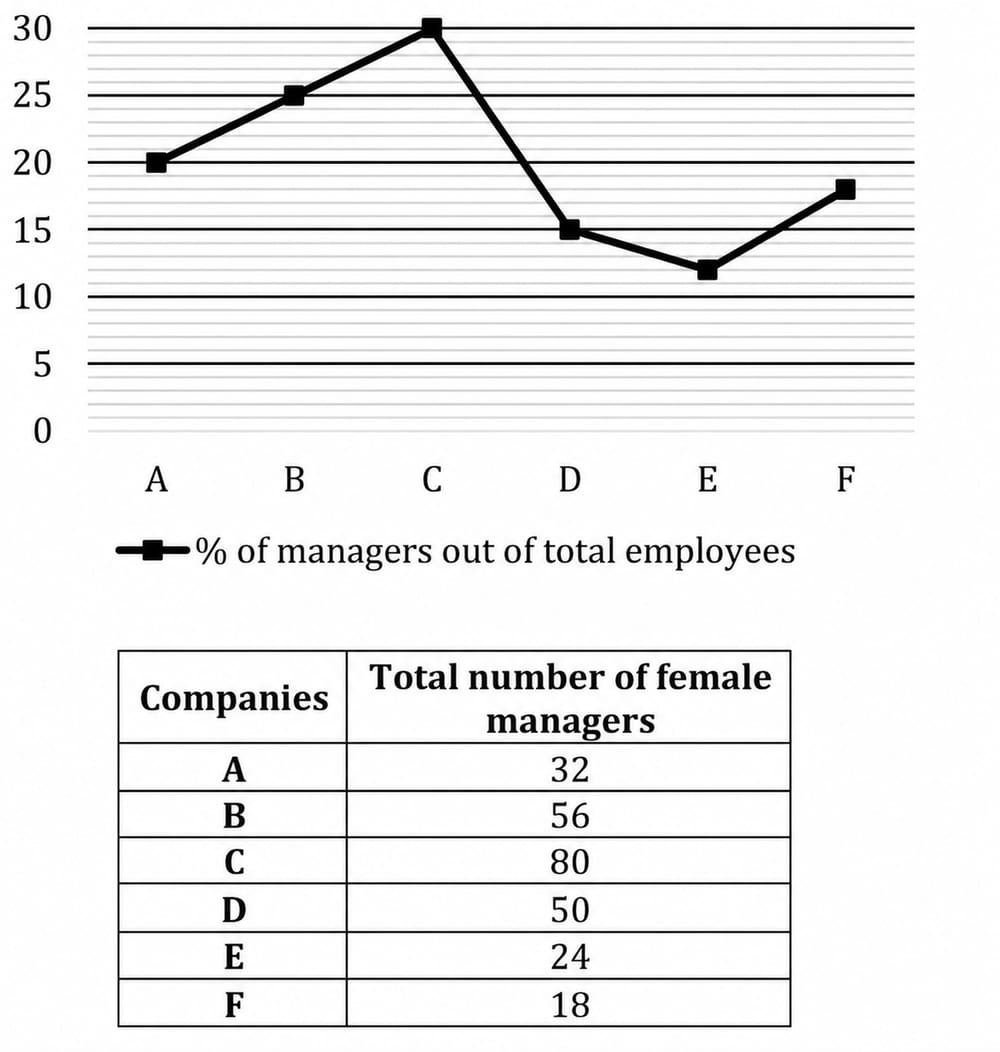
The difference between total male managers in company E and the total female managers in company E is 50% of total female managers in that company, then find total number of employees in company E (male mangers are more than female managers in company E)?
- A.
400
- B.
300
- C.
500
- D.
600
- E.
800
Attempted by 15 students.
Sign up free to check your answer
Sign up freeLoading lesson…