

The pie chart (i) given below shows percentage distribution of total people…
PYQ IBPS 2023 (paper not recorded)
The pie chart
(i) given below shows percentage distribution of total people (male + female) visited five different clubs and pie chart
(ii) shows percentage distribution of total male visited in these five clubs. Read the data carefully and answer the questions given below.
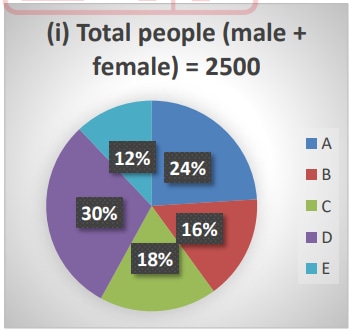
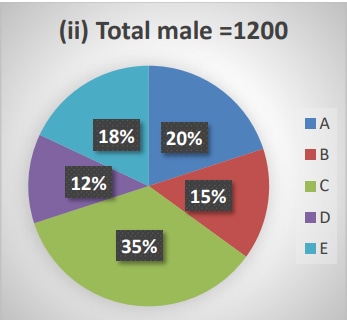
Total females visited club B and C together are what percent of total people visited club D.
- A.
40%
- B.
35%
- C.
36.3%
- D.
33.33%
- E.
30%
Attempted by 12 students.
Sign up free to check your answer
Sign up freeLoading lesson…