

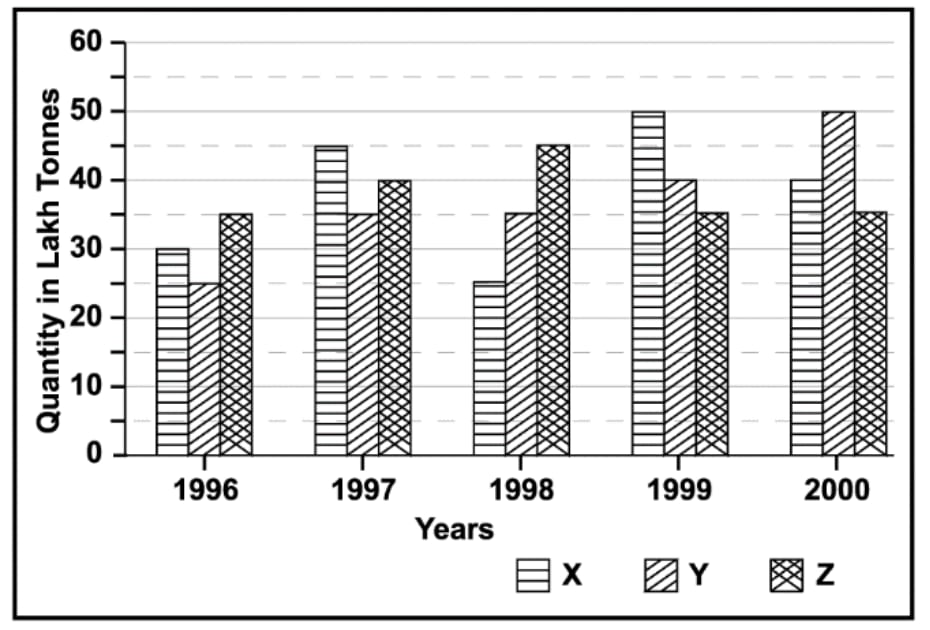
The bar graph given below shows the data of the production of paper (in lakh…
PYQ RSSB Computer Instructor 2026
The bar graph given below shows the data of the production of paper (in lakh tonnes) by three different companies X, Y and Z over the years. Production of Paper (in lakh tonnes) by Three Companies X, Y and Z over the Years. What is the ratio of the average production of Company X in the period 1998-2000 to the average production of Company Y in the same period? Select the most appropriate option.
- A.
23 : 25
- B.
27 : 29
- C.
1 : 1
- D.
15 : 17
- E.
Question not attempted
Attempted by 31 students.
Sign up free to check your answer
Sign up freeLoading lesson…