

The table below provides data on the number of candidates who appeared (A) and…
PYQ UGC NET 2020
The table below provides data on the number of candidates who appeared (A) and qualified (Q) in a test during the years from 2014 to 2019 from five different zones J, K, L, M and N. In accordance with the table, answer the questions.
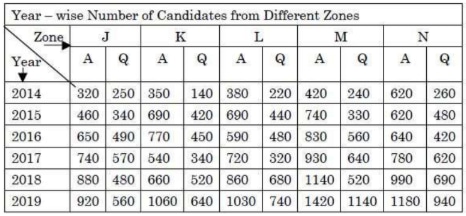
Ques: The number of candidates who appeared in the test from Zone-K in the year 2017 was approximately what percentage of the number of candidates who qualified the test from Zone-L in the year 2019?
- A.
88%
- B.
83%
- C.
73%
- D.
68%
Sign up free to check your answer
Sign up freeLoading lesson…