

The population of a city is plotted as a function of time (years) in graphic…
PYQ UGC NET 2010
The population of a city is plotted as a function of time (years) in graphic form below :
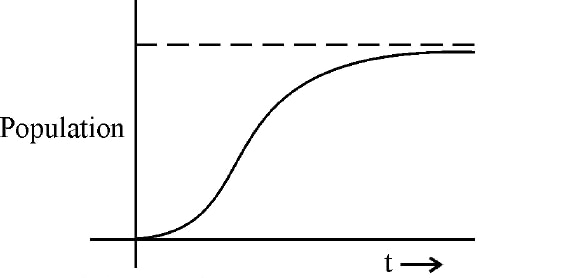
Which of the following inference can be drawn from above plot ?
- A.
The population increases exponentially.
- B.
The population increases in a parabolic fashion.
- C.
The population initially increases linearly and then stabilizes.
- D.
The population initially increases exponentially and then stabilizes.
Attempted by 1 students.
Sign up free to check your answer
Sign up freeLoading lesson…