

Study the bar graph showing the quantity and value of engineering-goods…
PYQ UGC NET 2009
Study the bar graph showing the quantity and value of engineering-goods exports from 2003 to 2007, then answer the question.
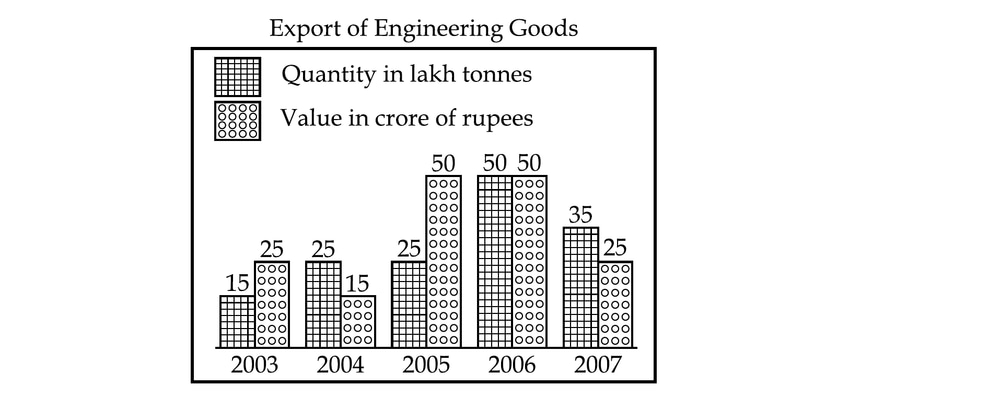
In which year was the quantity of exports 100% higher than in the previous year?
- A.
2004
- B.
2005
- C.
2006
- D.
2007
Attempted by 18 students.
Sign up free to check your answer
Sign up freeLoading lesson…