

The diagram below represents
PYQ KVS TGT/PGT 2013
The diagram below represents
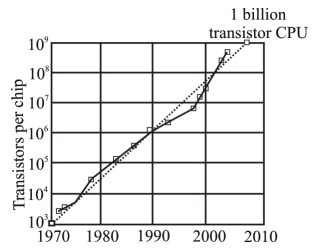
- A.
Moore's law
- B.
Newton Raphson method
- C.
Boyle's law
- D.
Gregor law
Attempted by 4709 students.
Sign up free to check your answer
Sign up freeLoading lesson…
PYQ KVS TGT/PGT 2013
The diagram below represents
Moore's law
Newton Raphson method
Boyle's law
Gregor law
Attempted by 4709 students.
Sign up free to check your answer
Sign up free