Directions: The graph given below represents the variation in daily earnings…
2023
Directions: The graph given below represents the variation in daily earnings (in rupees) over a week. Study the graph and answer the question that follows.
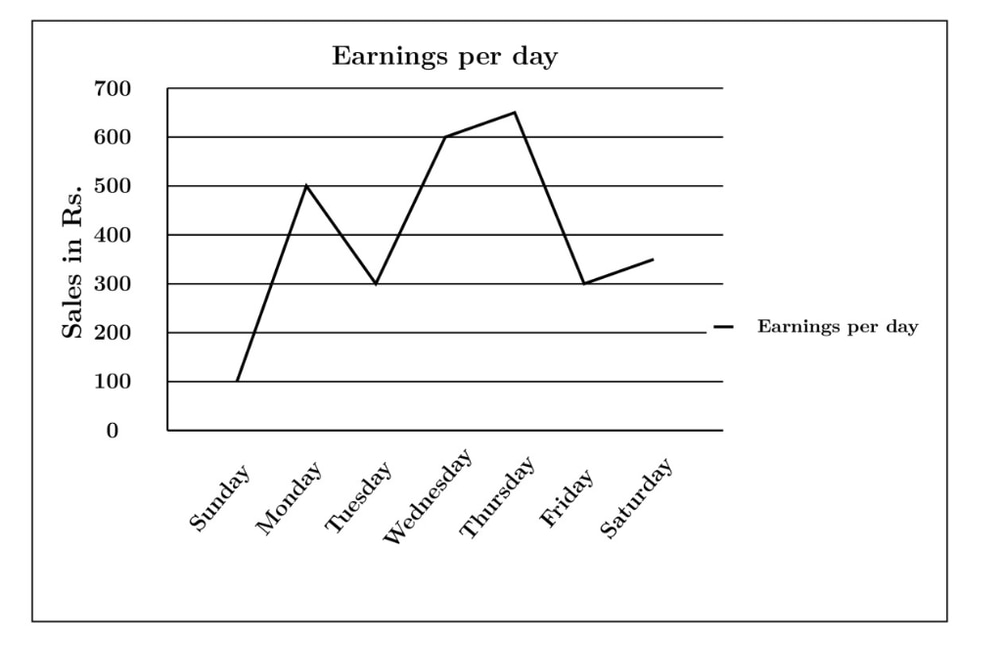
Between which pair of consecutive days was the difference in earnings the largest?
Answer: A. Sunday – Monday — ConceptIn a line graph of a quantity over time, the change between two consecutive points equals the absolute difference of their values: |value at later day…
- A.
Sunday – Monday
- B.
Tuesday – Wednesday
- C.
Thursday – Friday
- D.
None of these
Attempted by 319 students.
Show answer & explanation
Correct answer: A
Concept
In a line graph of a quantity over time, the change between two consecutive points equals the absolute difference of their values: |value at later day − value at earlier day|. The steepness of a line segment is proportional to this difference, but the exact comparison is made by computing each numeric gap.
Application
Read the earnings from the graph (in Rs): Sunday 100, Monday 500, Tuesday 300, Wednesday 600, Thursday 650, Friday 300, Saturday 350. Compute each consecutive-day difference:
Consecutive days | Earnings (Rs) | Difference (Rs) |
|---|---|---|
Sunday – Monday | 100 → 500 | 400 |
Monday – Tuesday | 500 → 300 | 200 |
Tuesday – Wednesday | 300 → 600 | 300 |
Wednesday – Thursday | 600 → 650 | 50 |
Thursday – Friday | 650 → 300 | 350 |
Friday – Saturday | 300 → 350 | 50 |
Cross-check
Among the offered pairs, the gaps are 400 (Sun–Mon), 300 (Tue–Wed) and 350 (Thu–Fri). The largest of these is 400, so the difference in earnings was greatest between Sunday and Monday.