Study the pie chart carefully and answer the given questions.The pie chart…
PYQ Accenture 2023PYQ Infosys 2024PYQ Hexaware 2025PYQ Cognizant 2024PYQ CO-CUBES 2024
Study the pie chart carefully and answer the given questions.The pie chart shows the percentage breakup of students in different classes from VI to X in the year 2017
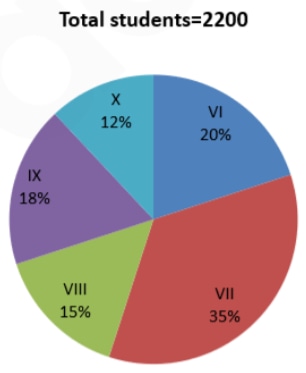
If in 2018, the total number of students in class VI and class VII is increased by 10% each and the total number of students in class VIII is decreased by 20% then what is the difference between the total number of students in class VI and VII together in 2018 to that of the total number of students in class VIII in 2018?
- A.
976
- B.
1067
- C.
1156
- D.
1078
Attempted by 20 students.
Sign up free to check your answer
Sign up freeLoading lesson…