

Directions: Read the pie chart carefully and answer the following question.…
PYQ IBPS 2023 (paper not recorded)
Directions: Read the pie chart carefully and answer the following question.
The pie chart shows the percentage distribution of questions attempted by four students (A, B, C and D) in an exam. The exam contains three subjects English, History and Mathematics, which consist of 120, 60 and 100 questions respectively.
The maximum number of questions a student can attempt is 240, and the total number of questions attempted by all the students together is 800.
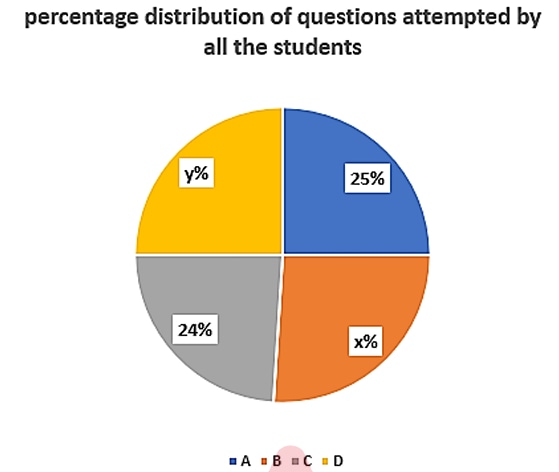
From which of the given statement(s) can we find the exact value of (x – y)?
I: If B attempted the highest number of questions and D attempted the lowest number of questions.
II: If B attempted more than 200 questions, then D attempted less than 190 questions.
- A.
Only (I)
- B.
Only (II)
- C.
Neither (I) nor (II)
- D.
Either (I) or (II)
- E.
Both (I) and (II) together
Attempted by 12 students.
Sign up free to check your answer
Sign up freeLoading lesson…