

The line graph below shows the total number of TVs sold and the difference…
PYQ IBPS 2025 (paper not recorded)
The line graph below shows the total number of TVs sold and the difference between cell phones and TVs sold by five different shops (A, B, C, D and E). Note: for every shop the total cell phones sold is more than the total TVs sold, so cell phones sold = TVs sold + difference.
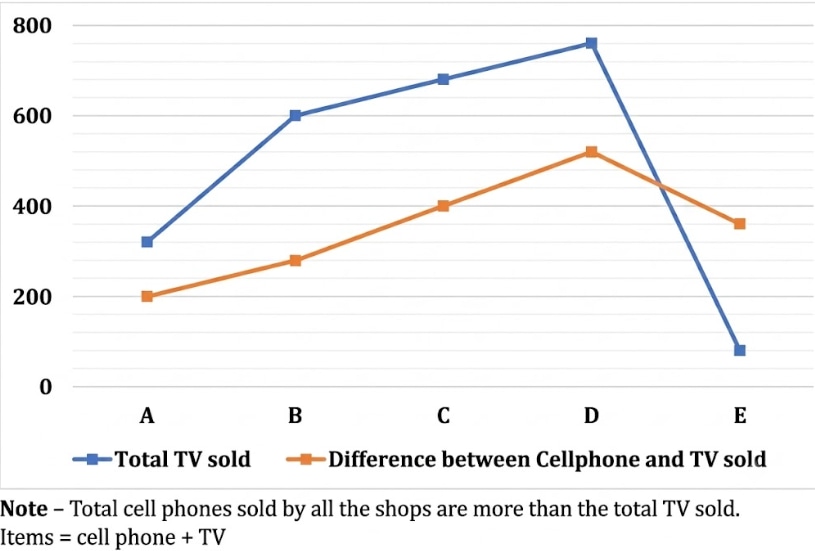
Find the average number of cell phones sold by shops B, C and E.
- A.
900
- B.
720
- C.
400
- D.
800
- E.
720
Attempted by 16 students.
Sign up free to check your answer
Sign up freeLoading lesson…