

Direction: Study the graph given below and answer the question that follows.…
PYQ IBPS 2018 (paper not recorded)
Direction: Study the graph given below and answer the question that follows.
The graph shows the percentage of literates in three different villages across three years.
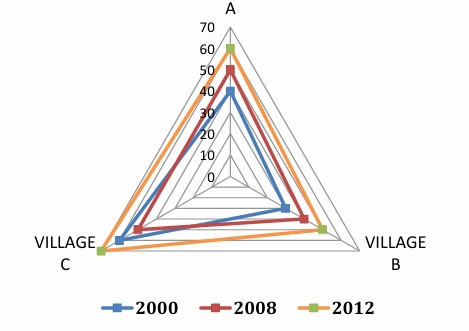
The sum of literates from Village B in 2000 and 2008 is 1530, and the sum of literates in 2008 and 2012 is 2010. If the sum of literates from Village B across all the given years is 2490, find the population of Village B in 2008.
- A.
2625
- B.
2200
- C.
2000
- D.
2150
- E.
2050
Attempted by 8 students.
Sign up free to check your answer
Sign up freeLoading lesson…